This article appears in the Fall 2019 issue of MontessoriPublic — Print Edition.

How many schools, where are they, and who is in them
By David Ayer
The Fall 2019 issue of MontessoriPublic focused on the growth and development of public Montessori programs in cities and regions such as Milwaukee, Cincinnati, Denver, Puerto Rico, and more.
There are two parts to this story—one part about what we k now, and one about what we don’t. The overall history of public Montessori in the U.S. is fairly well known and understood—even if, Hidden Figures style, there are stories that deserve to be shared more widely.
From the 1960s to today
Many early “second-wave” U.S. Montessorians in the 1960s were access-oriented, grounded in their Catholicism, even if nearly all schools were tuition-dependent. Desegregation orders (sometimes bitterly opposed and fought for decades) drove the growth of the first public programs as magnet schools in the 1970s through the 1990s, when many of those orders were listed.
Charter schools, first proposed in 1971 as a school reform to reduce bureaucracy and empower innovative teachers, came to life the 1990s and a second wave of public Montessori schools rolled across the country. Districts responded with choice programs of their own, under “district charter”, “innovation”, and other headings, and public Montessori has continued to spread and expand. More than 500 public Montessori schools are in operation today.
Counting what counts
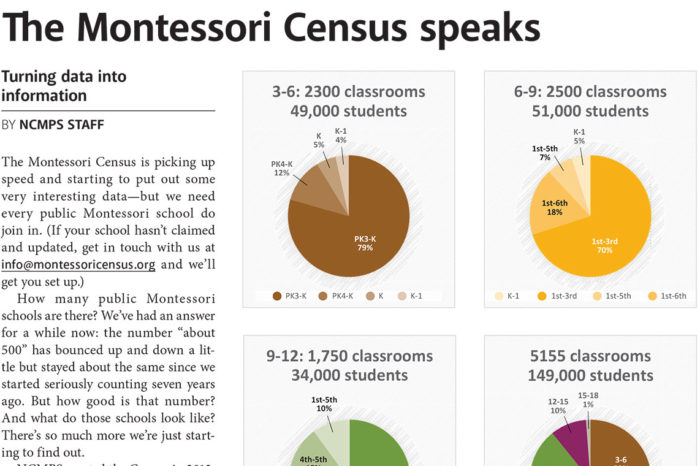
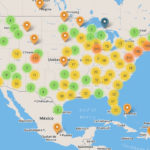
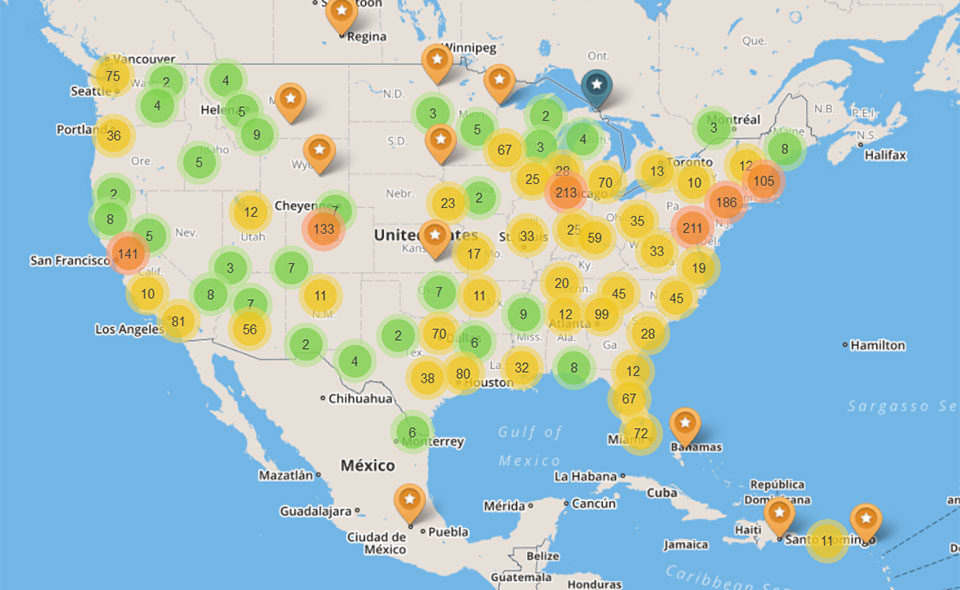
Or are there? As readers of MontessoriPublic and followers of the National Center for Montessori in the Public Sector know, our main tool for measuring the size, distribution, and characteristics of public Montessori has been the Montessori Census, launched in 2013 and updated and improved every year since. It’s far from a perfect collection of data, but it has a lot of value, and thanks to the participation of individual schools, it’s getting better and better.
In March of 2018, NCMPS launched a Census refresh and outreach campaign. At that time, it listed 511 public schools. Today it lists 499. That doesn’t look like growth! Does that ting really mean 13 schools closed last year, or at least that 13 more closed than opened?
Not exactly. Not even close, actually. Here’s what really happened.
Over the last year and a half, we’ve been digging into what is or was really a public Montessori school and what wasn’t—which ones were closed, or not Montessori any more, or never Montessori, or never public, or duplicates, or…some other kind of bad data. From that list of 511, we’ve purged 76 listings, leaving 441.
But does that mean there were only 441 in 2018? No! Thanks to schools which have joined the Census, we’ve added 58 listings that were either new schools (six) or should have been there in the first place. And of course every year schools close. So our best guess right now is that there were about 500 in 2018, and there are about 500 now. A few have closed, a few have opened, a few have moved or consolidated, but the number of schools is about the same.
So…we’re not growing, then? No, we’re definitely growing. Public Montessori has added six to nine schools a year for at least the last five years. And, closures are often smaller schools with declining enrollment. While new schools may start small, they’re naturally at the beginning their growth trajectory, so more new schools is good for growth even if the count stays the same. And some closures are actually growth: this year, for example, Arlington Public Schools consolidated five school-within-a-school classrooms into one stand-alone permanent home, a big advance. But the count went down.
 Count schools, or count children?

In fact, maybe the number of schools isn’t the right metric. It doesn’t capture the consolidations and relocations, and it entirely misses the expansions. Many new schools plan to expand by a grade a year when they open, but the school count would say the same. What we really care about is the number of children we’re reaching. This is a harder number to get. Schools can update that information on the Census, of course—and a big thanks to the more than 140 who have! But we know that’s a lot to ask of school leaders already playing multiple roles.
But we’ve recently been able to access a whole new source of data: the federal government. Now that we have a better idea of what’s really an operating public Montessori school and what isn’t, we’ve recently been able to match those schools to the National Center for Education Statistics (NCES) database. Their detailed information is about two years behind—they have a lot of schools to keep track of—so this is from the 2016-17 school year. But here’s what we know now.
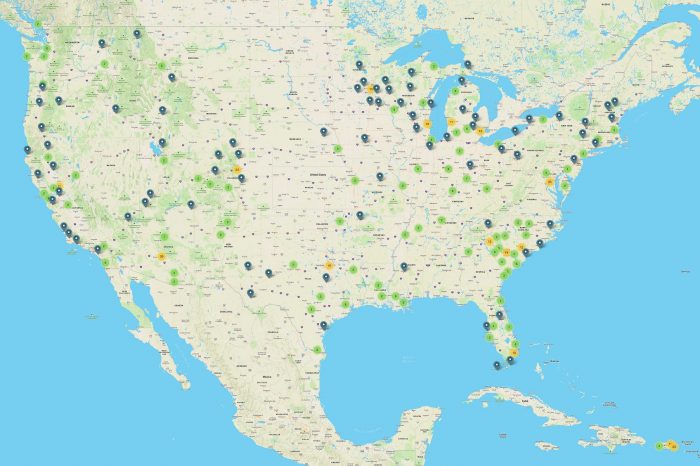
First, how many children? In 2016-17, there were 180,000 children in 455 public Montessori schools. With the new schools that have opened but not yet reported data, we can safely estimate that number at 200,000 today. That’s a number that starts to have some impact. When next year’s numbers come out, we’ll finally be able to start talking confidently about percentage growth.
Next, where are they? The short answer: the south. 37% of the schools and 45% of the children are in the 13 states making up this region, which accounts for just 38% of the U.S. population. Nationwide, 74% of the schools are in cities or large suburbs, 14% are rural, and 12% are in between.
What are the children like? In round numbers, 60,000 in 1st–3rd grade, 50,000 in 4th-6th, 40,000 in Pre-K and K (using the government’s categories), and 24,000 in secondary school, mostly middle school, but including 7,000 in high school. Overall, 44% report as White, 25% as Black, and 21% as Hispanic (these categories can overlap). 57% are in Title I Eligible schools nationally, but that goes up to 73% in the south. 44% qualify for free or reduced lunch (a standard proxy for socio-economic status), below the national average of 52%, but in the south that goes up to 61%.
This is all from a quick look at the data. There’s a lot more in there, and we’re working on integrating the Census data (which has things the government doesn’t, such as Montessori age groupings and affiliation) with the NCES trove. We’re working towards a Montessori “data repository” where participating schools can track and compare their own data, including input and output measures such as Developmental Environment Rating Scale (DERS) observations and test scores, and researchers can dig more deeply into what’s working best. Look to see further developments and more analysis in NCMPS communications.
And please, check you school’s Census listing at montessoricensus.org. If your school is listed and up to date, that’s great! Someone at work has given it some attention. If not—it’s easy to claim and update a school. Follow the instructions on the site, or reach out to us for help. Our data-loving team is standing by.
David Ayer is the Communications Director for the National Center for Montessori in the Public Sector.

David worked in private Montessori for more than twenty years as a parent, three-to-six year-old and adolescent teacher, administrator, writer, speaker, and advocate. In 2016 he began working with the National Center for Montessori in the Public Sector. David lives in Portland, Oregon.
You may also like